Leukemia, lymphoma, myeloma and myelodysplastic syndromes (MDS) are types of cancer that can affect the bone marrow, the blood cells, the lymph nodes and other parts of the lymphatic system.
Click on the links below to view statistics about each disease:
- General Blood Cancers
- Leukemia
- Lymphoma
- Myeloma
- Myelodysplastic syndromes (MDS)
- Myeloproliferative Neoplasms (MPNs)
General Blood Cancers
New Cases
- Approximately every 3 minutes one person in the United States (US) is diagnosed with a blood cancer.
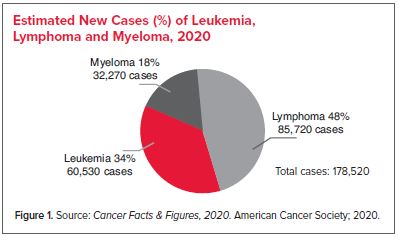
- An estimated combined total of 178,520 people in the US are expected to be diagnosed with leukemia, lymphoma or myeloma in 2020.
- New cases of leukemia, lymphoma and myeloma are expected to account for 9.9 percent of the estimated 1,806,590 new cancer cases diagnosed in the US in 2020.
Prevalence
- Prevalence is the estimated number of people alive on a certain date in a population who previously had a diagnosis of the disease. An estimated 1,297,027 people in the US are either living with, or are in remission from, leukemia, lymphoma or myeloma.
With the release of the 1975-2016 Cancer Statistics Review, the calculation of limited-duration prevalence estimates were modified to use data from the SEER 13 areas (not including the Alaska Natives Registry) using cases diagnosed from 1992 through 2015. Prior publications used data from the SEER 9 registries using cases diagnosed from 1975+. SEER 13 provides a larger population base and one which is more representative of the entire US, which allows better projections of US counts. Due to this methodology change, the estimates may differ significantly from those published in previous years.
Survival
- Relative survival compares the survival rate of a person diagnosed with a disease to that of a person without the disease. The most recent survival data available may not fully represent the outcomes of all current therapies and, as a result, may underestimate survival to a small degree.
Deaths
- Approximately every 9 minutes, someone in the US dies from a blood cancer. This statistic represents approximately 156 people each day or more than 6 people every hour.
- Leukemia, lymphoma and myeloma are expected to cause the deaths of an estimated 56,840 people in the US in 2020.
- These diseases are expected to account for 9.4 percent of the deaths from cancer in 2020, based on the estimated total of 606,520 cancer deaths.
*Data specified for “blood cancer” include leukemia, lymphoma and myeloma, and do not include data for myelodysplastic syndromes (MDS) or myeloproliferative neoplasms (MPNs)
Leukemia
New Cases
- In 2020, 60,530 people are expected to be diagnosed with leukemia.
Prevalence
- There are an estimated 376,508 people living with or in remission from leukemia in the US.
Survival
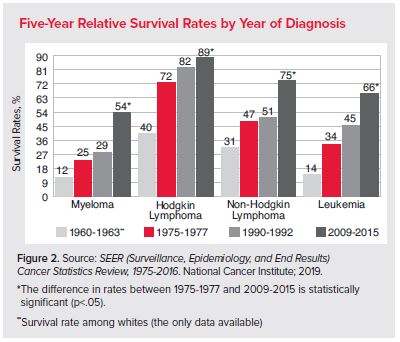
- The 5-year relative survival rate for leukemia has more than quadrupled, from 14 percent in whites from 1960 to 1963 (the only data available) to 65.8 percent for all races from 2009 to 2015.
- From 2009 to 2015, the five-year relative survival rates overall were
- ALL – 71.7 percent overall, 91.9 percent for children and adolescents younger than 15 years, and 94.1 percent for children younger than 5 years
- AML – 29.4 percent overall and 68.7 percent for children and adolescents younger than 15 years
- CLL – 88.2 percent
- CML – 69.7 percent*.
*The survival rate of CML in clinical trials is higher than the survival rate reported here, based on SEER data. It is speculated that close clinical monitoring and better medication adherence in clinical trials are associated with a lower risk of disease progression and higher rates of survival.
Deaths
- In 2020, 23,100 people are expected to die from leukemia (13,420 males and 9,680 females).
- From 2012 to 2016, leukemia was the sixth most common cause of cancer deaths in both men and women in the US.
Hodgkin (HL) and Non-Hodgkin (NHL) Lymphoma
New Cases
- In 2020, there are expected to be 85,720 new cases of lymphoma diagnosed in the US (8,480 cases of HL, 77,240 cases of NHL).
Prevalence
- There are an estimated 791,550 people living with, or in remission from, lymphoma in the US.
- There are 146,789 people living with or in remission from Hodgkin lymphoma
- There are 644,761 people living with or in remission from non-Hodgkin lymphoma
With the release of the 1975-2016 Cancer Statistics Review, the calculation of limited-duration prevalence estimates were modified to use data from the SEER 13 areas (not including the Alaska Natives Registry) using cases diagnosed from 1992 through 2015. Prior publications used data from the SEER 9 registries using cases diagnosed from 1975+. SEER 13 provides a larger population base and one which is more representative of the entire US, which allows better projections of US counts. Due to this methodology change, the estimates may differ significantly from those published in previous years.
Survival
- The 5-year relative survival rate for people with HL has more than doubled, from 40 percent in whites from 1960 to 1963 (the only data available) to 88.5 percent for all races from 2009 to 2015. The 5-year relative survival rate is 94.4 percent for all people with HL who were younger than 45 years at diagnosis.
- HL is now considered to be one of the most curable forms of cancer.
- The 5-year relative survival rate for people with NHL has risen from 31 percent in whites from 1960 to 1963 (the only data available) to 74.7 percent for all races from 2009 to 2015.
Deaths
- In 2020, an estimated 20,910 members of the US population are expected to die from lymphoma (19,940 NHL and 970 HL).
Myeloma
New Cases
- An estimated 32,270 new cases of myeloma (17,530 males and 14,740 females) are expected to be diagnosed in the US in 2020.
Prevalence
- An estimated 128,969 people in the US are living with or in remission from myeloma.
With the release of the 1975-2016 Cancer Statistics Review, the calculation of limited-duration prevalence estimates were modified to use data from the SEER 13 areas (not including the Alaska Natives Registry) using cases diagnosed from 1992 through 2015. Prior publications used data from the SEER 9 registries using cases diagnosed from 1975+. SEER 13 provides a larger population base and one which is more representative of the entire US, which allows better projections of US counts. Due to this methodology change, the estimates may differ significantly from those published in previous years.
Survival
- Five-year relative survival has increased from 12 percent from 1960 to 1963 (for whites, the only data available) to 53.7 percent from 2009 to 2015 (for all races and ethnicities).
- The 3-year survival rate as of January 1, 2015, was 66.3 percent (for all races and ethnicities).
- The 5-year survival rate is 76.2 percent for people with myeloma who were younger than 45 years at diagnosis.
Deaths
- Approximately 12,830 deaths from myeloma are anticipated in 2020 (7,190 males and 5,640 females).
Myelodysplastic Syndromes (MDS)
New Cases
- For the 5-year period from 2012 to 2016, there were 74,667 new cases of MDS throughout the US, averaging an estimated 14,933 cases per year.
- Approximately 43,292 cases were diagnosed in males (averaging 8,658 per year) and approximately 31,375 cases were diagnosed in females (averaging 6,275 per year).
- Approximately 43,292 cases were diagnosed in males (averaging 8,658 per year) and approximately 31,375 cases were diagnosed in females (averaging 6,275 per year).
Prevalence
-
The SEER program only recently began maintaining statistics for MDS. Prevalence statistics were not reported by SEER for MDS in 2020 at the time of this publication.
Survival
- The SEER program only recently began maintaining statistics for MDS. Survival statistics were not reported by SEER for MDS in 2020 at the time of this publication.
Deaths
- The SEER program only recently began maintaining statistics for MDS. Mortality statistics were not reported by SEER for MDS in 2020 at the time of this publication.
Myeloproliferative Neoplasms
New Cases
- For the 5-year period from 2012 to 2016, there were 57,151 new cases of MPNs throughout the US, averaging an estimated 11,430 cases per year.
- Approximately 27,882 cases were diagnosed in males (averaging 5,576 per year) and approximately 29,269 cases were diagnosed in females (averaging 5,854 per year).
- Approximately 27,882 cases were diagnosed in males (averaging 5,576 per year) and approximately 29,269 cases were diagnosed in females (averaging 5,854 per year).
Prevalence
The SEER program only recently began maintaining statistics for MPNs. Prevalence statistics were not reported by SEER for MPNs in 2020 at the time of this publication.
Survival
The SEER program only recently began maintaining statistics for MPNs. Survival statistics were not reported by SEER for MPNs in 2020 at the time of this publication.
Deaths
The SEER program only recently began maintaining statistics for MPNs. Mortality statistics were not reported by SEER for MPNs in 2020 at the time of this publication.
Source:
- Facts 2019-2020. Facts 2019-2020 provides updates from the American Cancer Society’s Cancer Facts & Figures 2020 (published online in 2020, https://www.cancer.org/research/cancer-facts-statistics.html) for estimated numbers of new blood cancer cases and estimated numbers of deaths due to blood cancers. The incidence rates, prevalence and mortality data in Facts 2019-2020 reflect the statistics from the National Cancer Institute’s Surveillance, Epidemiology and End Results (SEER) Program, Cancer Statistics Review (CSR) 1975-2016 (published online in April 2019, www.seer.cancer.gov). National incidence counts are generated from the United States Cancer Statistics (USCS) Public Use Database for 2001-2016 (www.cdc.gov/cancer/uscs/public-use/). Incidence rates by state are provided by the North American Association of Central Cancer Registries, Cancer in North America: 2012-2016 (published online in May 2019, www.naaccr.org).
Please consider a donation to LLS so we can continue to provide patient support and education and fund research to improve outcomes for all blood cancer patients.


